Introduction
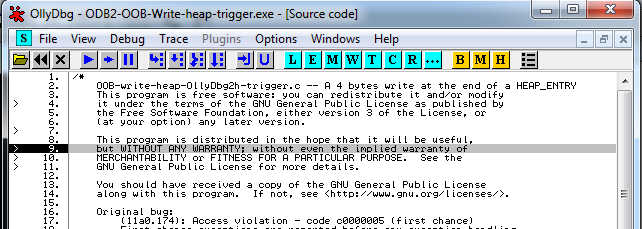
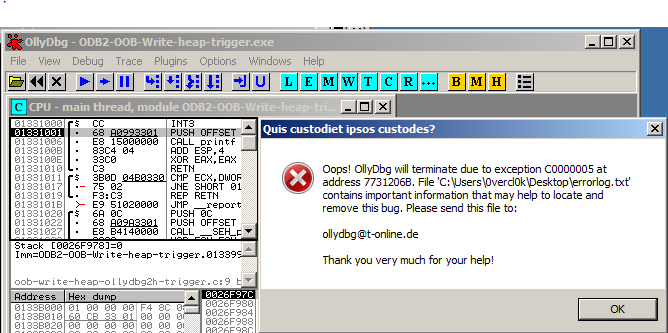
Yesterday afternoon, I was peacefully coding some stuff you know but I couldn't make my code working. As usual, in those type of situations you fire up your debugger in order to understand what is going on under the hood. That was a bit weird, to give you a bit of context I was doing some inline x86 assembly, and I've put on purpose an int3 just before the piece of assembly code I thought was buggy. Once my file loaded in OllyDbg2, I hit F9 in order to reach quickly the int3 I've slipped into the inline assembly code. A bit of single-stepping, and BOOM I got a nasty crash. It happens sometimes, and that's uncool. Then, I relaunch my binary and try to reproduce the bug: same actions and BOOM again. OK, this time it's cool, I got a reproducible crash in OllyDbg2.
I like when things like that happens to me (remember the crashes I've found in OllyDbg/IDA here: PDB Ain't PDD), it's always a nice exercise for me where I've to:
- pinpoint the bug in the application: usually not trivial when it's a real/big application
- reverse-engineer the codes involved in the bug in order to figure out why it's happening (sometimes I got the sources, sometimes I don't like this time)
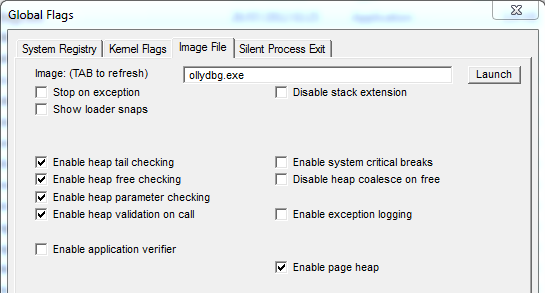
In this post, I will show you how I've manage to pinpoint where the bug was, using GFlags, PageHeap and WinDbg. Then, we will reverse-engineer the buggy code in order to understand why the bug is happening, and how we can code a clean trigger.
The crash
The first thing I did was to launch WinDbg to debug OllyDbg2 to debug my binary (yeah.). Once OllyDbg2 has been started up, I reproduced exactly the same steps as previously to trigger the bug and here is what WinDbg was telling me:
HEAP[ollydbg.exe]: Heap block at 00987AB0 modified at 00987D88 past
requested size of 2d0

(a60.12ac): Break instruction exception - code 80000003 (first chance)
eax=00987ab0 ebx=00987d88 ecx=76f30b42 edx=001898a5 esi=00987ab0 edi=000002d0
eip=76f90574 esp=00189aec ebp=00189aec iopl=0         nv up ei pl nz na po nc
cs=0023  ss=002b  ds=002b  es=002b  fs=0053  gs=002b             efl=00200202
ntdll!RtlpBreakPointHeap+0x23:
76f90574 cc              int     3
We got a debug message from the heap allocator informing us the process has written outside of its heap buffer. The thing is, this message and the breakpoint are not triggered when the faulty write is done but triggered like after, when another call to the allocator has been made. At this moment, the allocator is checking the chunks are OK and if it sees something weird, it outputs a message and breaks. The stack-trace should confirm that:
0:000> k
ChildEBP RetAddr
00189aec 76f757c2 ntdll!RtlpBreakPointHeap+0x23
00189b04 76f52a8a ntdll!RtlpCheckBusyBlockTail+0x171
00189b24 76f915cf ntdll!RtlpValidateHeapEntry+0x116
00189b6c 76f4ac29 ntdll!RtlDebugFreeHeap+0x9a
00189c60 76ef34a2 ntdll!RtlpFreeHeap+0x5d
00189c80 75d8537d ntdll!RtlFreeHeap+0x142
00189cc8 00403cfc KERNELBASE!GlobalFree+0x27
00189cd4 004cefc0 ollydbg!Memfree+0x3c
...
As we said just above, the message from the heap allocator has been probably triggered when OllyDbg2 wanted to free a chunk of memory.
Basically, the problem with our issue is the fact we don't know:
- where the heap chunk has been allocated
- where the faulty write has been made
That's what makes our bug not trivial to debug without the suitable tools. If you want to have more information about debugging heap issues efficiently, you should definitely read the heap chapter in Advanced Windows Debugging (cheers `Ivan).
Pinpointing the heap issue: introducing full PageHeap
In a nutshell, the full PageHeap option is really powerful to diagnostic heap issues, here are at least two reasons why:
- it will save where each heap chunk has been allocated
- it will allocate a guard page at the end of our chunk (thus when the faulty write occurs, we might have a write access exception)
To do so, this option changes a bit how the allocator works (it adds more meta-data for each heap chunk, etc.) ; if you want more information, try at home allocating stuff with/without page heap and compare the allocated memory. Here is how looks like a heap chunk when PageHeap full is enabled:
(f48.1140): Access violation - code c0000005 (first chance)
First chance exceptions are reported before any exception handling.
This exception may be expected and handled.

eax=000000b4 ebx=0f919abc ecx=0f00ed30 edx=00000b73 esi=00188694 edi=005d203c
eip=004ce769 esp=00187d60 ebp=00187d80 iopl=0         nv up ei pl zr na pe nc
cs=0023  ss=002b  ds=002b  es=002b  fs=0053  gs=002b             efl=00010246
ollydbg!Findfreehardbreakslot+0x21d9:
004ce769 891481          mov     dword ptr [ecx+eax*4],edx ds:002b:0f00f000=????????
Woot, this is very cool, because now we know exactly where something is going wrong. Let's get more information about the heap chunk now:
0:000> !heap -p -a ecx
    address 0f00ed30 found in
    _DPH_HEAP_ROOT @ 4f11000
    in busy allocation
    (  DPH_HEAP_BLOCK:  UserAddr  UserSize -  VirtAddr VirtSize)
              f6f1b2c:  f00ed30        2d0 -  f00e000  2000

    6e858e89 verifier!AVrfDebugPageHeapAllocate+0x00000229
    76f90d96 ntdll!RtlDebugAllocateHeap+0x00000030
    76f4af0d ntdll!RtlpAllocateHeap+0x000000c4
    76ef3cfe ntdll!RtlAllocateHeap+0x0000023a
    75d84e55 KERNELBASE!GlobalAlloc+0x0000006e
    00403bef ollydbg!Memalloc+0x00000033
    004ce5ec ollydbg!Findfreehardbreakslot+0x0000205c
    004cf1df ollydbg!Getsourceline+0x0000007f
    00479e1b ollydbg!Getactivetab+0x0000241b
    0047b341 ollydbg!Setcpu+0x000006e1
    004570f4 ollydbg!Checkfordebugevent+0x00003f38
    0040fc51 ollydbg!Setstatus+0x00006441
    004ef9ef ollydbg!Pluginshowoptions+0x0001214f
With this really handy command we got a lot of relevant information:
- This chunk has a size of 0x2d0 bytes. Thus, starting from 0xf00ed30 to 0xf00efff.
- The faulty write now makes sense: the application tries to write 4 bytes outside of its heap buffer (off-by-one on an unsigned array I guess).
- The memory has been allocated in ollydbg!Memalloc (called by ollydbg!Getsourceline, PDB related ?). We will study that routine later in the post.
- The faulty write occurs at address 0x4ce769.
Looking inside OllyDbg2
We are kind of lucky, the routines involved with this bug are quite simple to reverse-engineer, and Hexrays works just like a charm. Here is the C code (the interesting part at least) of the buggy function:
//ollydbg!buggy @ 0x004CE424
signed int buggy(struct_a1 *u)
{
  int file_size;
  unsigned int nbchar;
  unsigned __int8 *file_content;
  int nb_lines;
  int idx;

  // ...
  file_content = (unsigned __int8 *)Readfile(&u->sourcefile, 0, &file_size);
  // ...
  nbchar = 0;
  nb_lines = 0;
  while(nbchar < file_size)
  {
    // doing stuff to count all the char, and all the lines in the file
    // ...
  }

  u->mem1_ov = (unsigned int *)Memalloc(12 * (nb_lines + 1), 3);
  u->mem2 = Memalloc(8 * (nb_lines + 1), 3);
  if ( u->mem1_ov && u->mem2 )
  {
    nbchar = 0;
    nb_lines2 = 0;
    while ( nbchar < file_size && file_content[nbchar] )
    {
      u->mem1_ov[3 * nb_lines2] = nbchar;
      u->mem1_ov[3 * nb_lines2 + 1] = -1;
      if ( nbchar < file_size )
      {
        while ( file_content[nbchar] )
        {
            // Consume a line, increment stuff until finding a '\r' or '\n' sequence
            // ..
        }
      }
      ++nb_lines2;
    }
    // BOOM!
    u->mem1_ov[3 * nb_lines2] = nbchar;
    // ...
  }
}
So, let me explain what this routine does:
- This routine is called by OllyDbg2 when it finds a PDB database for your binary and, more precisely, when in this database it finds the path of your application's source codes. It's useful to have those kind of information when you are debugging, OllyDbg2 is able to tell you at which line of your C code you're currently at.
D:\TODO\crashes\odb2-OOB-write-heap>wc -l OOB-write-heap-OllyDbg2h-trigger.c
59 OOB-write-heap-OllyDbg2h-trigger.c
Good.
- From line 24 to 39: we have a loop similar to previous one. It's basically counting lines again and initializing the memory we just allocated with some information.
- At line 41: we have our bug. Somehow, we can manage to get out of the loop with "nb_lines2 = nb_lines + 1". That means the line 41 will try to write one cell outside of our buffer. In our case, if we have "nb_lines2 = 60" and our heap buffer starting at 0xf00ed30, it means we're going to try to write at (0xf00ed30+6034)=0xf00f000. That's exactly what we saw earlier.
At this point, we have fully explained the bug. If you want to do some dynamic analysis in order to follow important routines, I've made several breakpoints, here they are:
bp 004CF1BF ".printf \"[Getsourceline] %mu\\n[Getsourceline] struct: 0x%x\", poi(esp + 4), eax ; .if(eax != 0){ .if(poi(eax + 0x218) == 0){ .printf \" field: 0x%x\\n\", poi(eax + 0x218); gc }; } .else { .printf \"\\n\\n\" ; gc; };"
bp 004CE5DD ".printf \"[buggy] Nbline: 0x%x \\n\", eax ; gc"
bp 004CE5E7 ".printf \"[buggy] Nbbytes to alloc: 0x%x \\n\", poi(esp) ; gc"
bp 004CE742 ".printf \"[buggy] NbChar: 0x%x / 0x%x - Idx: 0x%x\\n\", eax, poi(ebp - 1C), poi(ebp - 8) ; gc"
bp 004CE769 ".printf \"[buggy] mov [0x%x + 0x%x], 0x%x\\n\", ecx, eax * 4, edx"
On my environment, it gives me something like:
[Getsourceline] f:\dd\vctools\crt_bld\self_x86\crt\src\crt0.c
[Getsourceline] struct: 0x0
[...]
[Getsourceline] oob-write-heap-ollydbg2h-trigger.c
[Getsourceline] struct: 0xaf00238 field: 0x0
[buggy] Nbline: 0x3b
[buggy] Nbbytes to alloc: 0x2d0
[buggy] NbChar: 0x0 / 0xb73 - Idx: 0x0
[buggy] NbChar: 0x4 / 0xb73 - Idx: 0x1
[buggy] NbChar: 0x5a / 0xb73 - Idx: 0x2
[buggy] NbChar: 0xa4 / 0xb73 - Idx: 0x3
[buggy] NbChar: 0xee / 0xb73 - Idx: 0x4
[...]
[buggy] NbChar: 0xb73 / 0xb73 - Idx: 0x3c
[buggy] mov [0xb031d30 + 0x2d0], 0xb73

eax=000000b4 ebx=12dfed04 ecx=0b031d30 edx=00000b73 esi=00188694 edi=005d203c
eip=004ce769 esp=00187d60 ebp=00187d80 iopl=0         nv up ei pl zr na pe nc
cs=0023  ss=002b  ds=002b  es=002b  fs=0053  gs=002b             efl=00200246
ollydbg!Findfreehardbreakslot+0x21d9:
004ce769 891481          mov     dword ptr [ecx+eax*4],edx ds:002b:0b032000=????????
Repro@home
- Download the last version of OllyDbg2 here, extract the files
- Download the three files from odb2-oob-write-heap, put them in the same directory than ollydbg.exe is
- Launch WinDbg and open the last version of OllyDbg2
- Set your breakpoints (or not), F5 to launch
- Open the trigger in OllyDbg2
- Press F9 when the binary is fully loaded
- BOOM :). Note that you may not have a visible crash (remember, that's what made our bug not trivial to debug without full pageheap). Try to poke around with the debugger: restarting the binary or closing OllyDbg2 should be enough to get the message from the heap allocator in your debugger.
Fun fact
You can even trigger the bug with only the binary and the PDB database. The trick is to tamper the PDB, and more precisely where it keeps the path to your source code. That way, when OllyDbg2 will load the PDB database, it will read that same database like it's the source code of the application. Awesome.

Conclusion
Those kind of crashes are always an occasion to learn new things. Either it's trivial to debug/repro and you won't waste much of your time, or it's not and you will improve your debugger/reverse-engineer-fu on a real example. So do it!
By the way, I doubt the bug is exploitable and I didn't even try to exploit it ; but if you succeed I would be really glad to read your write-up! But if we assume it's exploitable for a second, you would still have to distribute the PDB file, the source file (I guess it would give you more control than with the PDB) and the binary to your victim. So no big deal.
If you are too lazy to debug your crashes, send them to me, I may have a look at it!
Oh, I almost forgot: we are still looking for motivated contributors to write cool posts, spread the world.