Introduction
Binary instrumentation and analysis have been subjects that I have always found fascinating. At compile time via clang, or at runtime with dynamic binary instrumentation frameworks like Pin or DynamoRIO. One thing I have always looked for though, is a framework able to statically instrument a PE image. A framework designed a bit like clang where you can write 'passes' doing various things: transformation of the image, analysis of code blocks, etc. Until a couple of months ago, I wasn't aware of any public and robust projects providing this capability (as in, able to instrument real-world scale programs like Chrome or similar).
In this post (it's been a while I know!), I'll introduce the syzygy transformation tool chain with a focus on its instrumenter, and give an overview of the framework, its capabilities, its limitations, and how you can write transformations yourself. As examples, I'll walk through two simple examples: an analysis pass generating a call-graph, and a transformation pass rewriting the function __report_gsfailure in /GS protected binaries.
Syzygy
Introduction and a little bit of History
syzygy is a project written by Google labeled as a "transformation tool chain". It encompasses a suite of various utilities: instrument.exe is the application invoking the various transformation passes and apply them on a binary, grinder.exe, reorder.exe, etc. In a nutshell, the framework is able to (non exhaustive list):
- Read and write PDB files,
- 'Decompose' PE32 binaries built with MSVC (with the help of full PDB symbol),
- Assemble Intel x86 32 bits code,
- Disassemble Intel x86 32 bits code (via Distorm),
- 'Relink' an instrumented binary.
You also may have briefly heard about the project a while back in this post from May 2013 on Chromium's blog: Testing Chromium: SyzyASAN, a lightweight heap error detector. As I am sure you all know, AddressSanitizer is a compile-time instrumentation whose purpose is to detect memory errors in C/C++ programs. Long story short, AddressSanitizer tracks the state of your program's memory and instrument memory operations (read / write / heap allocation / heap free) at runtime to make sure that they are 'safe'. For example, in a normal situation reading off by one out-of-bounds on a static sized stack buffer will most likely not result in a crash. AddressSanitizer's job is to detect this issue and to report it to the user.
Currently there is no real equivalent on Windows platforms. The only supported available technology that could help with detecting memory errors is the Page Heap. Even though today, clang for Windows is working (Chrome announced that Windows builds of Chrome now use clang), this was not the case back in 2013. As a result, Google built SyzyASAN, which is the name of a transformation aiming at detecting memory errors in PE32 binaries. This transform is built on top of the syzygy framework, and you can instrument your binary with it via the instrument.exe tool. One consequence of the above, is that the framework has to be robust and accurate enough to instrument Chrome; as a result the code is heavily tested which is awesome for us (it is also nearly the only documentation available too 0:-))!
Compiling
In order to get a development environment setup you need to follow specific steps to get all the chromium build/dev tools installed. depot_tools is the name of the package containing everything you need to properly build the various chromium projects; it includes things like Python, GYP, Ninja, git, etc.
Once depot_tools is installed, it is just a matter of executing the below commands for getting the code and compiling it:
> set PATH=D:\Codes\depot_tools;%PATH%
> mkdir syzygy
> cd syzygy
> fetch syzygy
> cd syzygy\src
> ninja -C out\Release instrument
If you would like more information on the matter, I suggest you read this wiki page: SyzygyDevelopmentGuide.
Terminology
The terminology used across the project can be a bit misleading or confusing at first, so it is a good time to describe the key terms and their meanings: a BlockGraph is a basically a container of blocks. A BlockGraph::Block can be either a code block, or a data block (the IMAGE_NT_HEADERS. Every block has various properties like an identifier, a name, etc. and belongs to a section (as in PE sections). Most of those properties are mutable, and you are free to play with them and they will get picked-up by the back-end when relinking the output image. In addition to being a top-level container of blocks, the BlockGraph also keeps track of the sections in your executable. Blocks also have a concept of referrers and references. A reference is basically a link from Block foo to Block bar; where bar is the referent. A referrer can be seen as a cross-reference (in the IDA sense): foo would be a referrer of bar. These two key concepts are very important when building transforms as they also allow you to walk the graph faster. Transferring referrers to another Block is also a very easy operation for example (and is super powerful).
Something that also got me confused at first is their name for a Block is not a basic-block as we know them. Instead, it is a function; a set of basic-blocks. Another key concept being used is called SourceRanges. As Blocks can be combined together or split, they are made so that they look after their own address-space mapping bytes from the original image to bytes in the block.
Finally, the container of basic-blocks as we know them is a BasicBlockSubGraph (I briefly mention it a bit later in the post).
Oh, one last thing: the instrumenter is basically the application that decomposes an input binary (comparable to a front-end), present the deconstructed binary (functions, blocks, instructions) to transforms (comparable to a mid-end) that modifies, and finally the back-end part that reconstruct your instrumented binary.
Debugging session
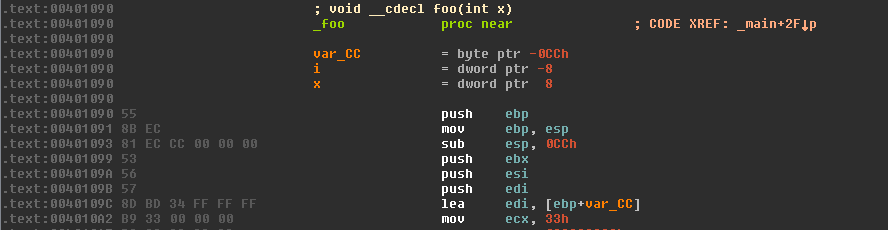
To make things clearer - and because I like debugging sessions - I think it is worthwhile to spend a bit of time in a debugger actually seeing the various structures and how they map to some code we know. Let's take the following C program and compile it in debug mode (don't forget to enable the full PDB generation with the following linker flag: /PROFILE):
#include <stdio.h>

void foo(int x) {
  for(int i = 0; i < x; ++i) {
    printf("Binary rewriting with syzygy\n");
  }
}

int main(int argc, char *argv[]) {
  printf("Hello doar-e.\n");
  foo(argc);
  return 0;
}
Throw it to your favorite debugger with the following command - we will use the afl transformation as an example transform to analyze the data we have available to us:
instrument.exe --mode=afl --input-image=test.exe --output-image=test.instr.exe
And let's place this breakpoint:
bm instrument!*AFLTransform::OnBlock ".if(@@c++(block->type_ == 0)){ }.else{ g }"
Now it's time to inspect the Block associated with our function foo from above:
0:000> g
eax=002dcf80 ebx=00000051 ecx=00482da8 edx=004eaba0 esi=004bd398 edi=004bd318
eip=002dcf80 esp=0113f4b8 ebp=0113f4c8 iopl=0         nv up ei pl nz na po nc
cs=0023  ss=002b  ds=002b  es=002b  fs=0053  gs=002b             efl=00000202
instrument!instrument::transforms::AFLTransform::OnBlock:
002dcf80 55              push    ebp

0:000> dx block
  [+0x000] id_              : 0x51
  [+0x004] type_            : CODE_BLOCK (0)
  [+0x008] size_            : 0x5b
  [+0x00c] alignment_       : 0x1
  [+0x010] alignment_offset_ : 0
  [+0x014] padding_before_  : 0x0
  [+0x018] name_            : 0x4ffc70 : "foo"
  [+0x01c] compiland_name_  : 0x4c50b0 : "D:\tmp\test\Debug\main.obj"
  [+0x020] addr_            [Type: core::detail::AddressImpl<0>]
  [+0x024] block_graph_     : 0x48d10c
  [+0x028] section_         : 0x0
  [+0x02c] attributes_      : 0x8
  [+0x030] references_      : { size=0x3 }
  [+0x038] referrers_       : { size=0x1 }
  [+0x040] source_ranges_   [Type: core::AddressRangeMap<core::AddressRange<int,unsigned int>,core::AddressRange<core::detail::AddressImpl<0>,unsigned int> >]
  [+0x04c] labels_          : { size=0x3 }
  [+0x054] owns_data_       : false
  [+0x058] data_            : 0x49ef50 : 0x55
  [+0x05c] data_size_       : 0x5b
The above shows us every the different properties available in a Block; we can see it is named foo, has the identifier 0x51 and has a size of 0x5B bytes.

main function as it calls into foo.
0:000> dx -r1 (*((instrument!std::pair<block_graph::BlockGraph::Block *,int> *)0x4f87c0))
  first            : 0x4bd3ac
  second           : 48

0:000> dx -r1 (*((instrument!block_graph::BlockGraph::Block *)0x4bd3ac))
    [+0x000] id_              : 0x52
    [+0x004] type_            : CODE_BLOCK (0)
    [+0x008] size_            : 0x4d
    [+0x00c] alignment_       : 0x1
    [+0x010] alignment_offset_ : 0
    [+0x014] padding_before_  : 0x0
    [+0x018] name_            : 0x4c51a0 : "main"
    [+0x01c] compiland_name_  : 0x4c50b0 : "D:\tmp\test\Debug\main.obj"
    [+0x020] addr_            [Type: core::detail::AddressImpl<0>]
    [+0x024] block_graph_     : 0x48d10c
    [+0x028] section_         : 0x0
    [+0x02c] attributes_      : 0x8
    [+0x030] references_      : { size=0x4 }
    [+0x038] referrers_       : { size=0x1 }
    [+0x040] source_ranges_   [Type: core::AddressRangeMap<core::AddressRange<int,unsigned int>,core::AddressRange<core::detail::AddressImpl<0>,unsigned int> >]
    [+0x04c] labels_          : { size=0x3 }
    [+0x054] owns_data_       : false
    [+0x058] data_            : 0x49efb0 : 0x55
    [+0x05c] data_size_       : 0x4d
Something to keep in mind when it comes to references is that they are not simply a pointer to a block. A reference does indeed reference a block (duh), but it also has an offset associated to this block to point exactly at where the data is being referenced from.
// Represents a reference from one block to another. References may be offset.
// That is, they may refer to an object at a given location, but actually point
// to a location that is some fixed distance away from that object. This allows,
// for example, non-zero based indexing into a table. The object that is
// intended to be dereferenced is called the 'base' of the offset.
//
// BlockGraph references are from a location (offset) in one block, to some
// location in another block. The referenced block itself plays the role of the
// 'base' of the reference, with the offset of the reference being stored as
// an integer from the beginning of the block. However, basic block
// decomposition requires breaking the block into smaller pieces and thus we
// need to carry around an explicit base value, indicating which byte in the
// block is intended to be referenced.
//
// A direct reference to a location will have the same value for 'base' and
// 'offset'.
//
// Here is an example:
//
//        /----------\
//        +---------------------------+
//  O     |          B                | <--- Referenced block
//        +---------------------------+      B = base
//  \-----/                                  O = offset
//
Let's have a look at the references associated with the foo block now. If you look closely at the block, the set of references is of size 3... what could they be?
One for the printf function, one for the data Block for the string passed to printf maybe?
First reference:
----------------

0:000> dx -r1 (*((instrument!std::pair<int const ,block_graph::BlockGraph::Reference> *)0x4f5640))
    first            : 57
    second           [Type: block_graph::BlockGraph::Reference]
0:000> dx -r1 (*((instrument!block_graph::BlockGraph::Reference *)0x4f5644))
    [+0x000] type_            : ABSOLUTE_REF (1) [Type: block_graph::BlockGraph::ReferenceType]
    [+0x004] size_            : 0x4
    [+0x008] referenced_      : 0x4ce334
    [+0x00c] offset_          : 0
    [+0x010] base_            : 0
0:000> dx -r1 (*((instrument!block_graph::BlockGraph::Block *)0x4ce334))
    [+0x000] id_              : 0xbc
    [+0x004] type_            : DATA_BLOCK (1)
[...]
    [+0x018] name_            : 0xbb90f8 : "??_C@_0BO@LBGMPKED@Binary?5rewriting?5with?5syzygy?6?$AA@"
    [+0x01c] compiland_name_  : 0x4c50b0 : "D:\tmp\test\Debug\main.obj"
[...]
    [+0x058] data_            : 0x4a11e0 : 0x42
    [+0x05c] data_size_       : 0x1e
0:000> da 0x4a11e0
004a11e0  "Binary rewriting with syzygy."

Second reference:
-----------------

0:000> dx -r1 (*((instrument!std::pair<int const ,block_graph::BlockGraph::Reference> *)0x4f56a0))
    first            : 62
    second           [Type: block_graph::BlockGraph::Reference]
0:000> dx -r1 (*((instrument!block_graph::BlockGraph::Reference *)0x4f56a4))
    [+0x000] type_            : PC_RELATIVE_REF (0) [Type: block_graph::BlockGraph::ReferenceType]
    [+0x004] size_            : 0x4
    [+0x008] referenced_      : 0x4bd42c
    [+0x00c] offset_          : 0
    [+0x010] base_            : 0
0:000> dx -r1 (*((instrument!block_graph::BlockGraph::Block *)0x4bd42c))
    [+0x000] id_              : 0x53
    [+0x004] type_            : CODE_BLOCK (0)
[...]
    [+0x018] name_            : 0x4ffd60 : "printf"
    [+0x01c] compiland_name_  : 0x4c50b0 : "D:\tmp\test\Debug\main.obj"
[...]

Third reference:
----------------

0:000> dx -r1 (*((instrument!std::pair<int const ,block_graph::BlockGraph::Reference> *)0x4f5a90))
    first            : 83
    second           [Type: block_graph::BlockGraph::Reference]
0:000> dx -r1 (*((instrument!block_graph::BlockGraph::Reference *)0x4f5a94))
    [+0x000] type_            : PC_RELATIVE_REF (0) [Type: block_graph::BlockGraph::ReferenceType]
    [+0x004] size_            : 0x4
    [+0x008] referenced_      : 0x4bd52c
    [+0x00c] offset_          : 0
    [+0x010] base_            : 0
0:000> dx -r1 (*((instrument!block_graph::BlockGraph::Block *)0x4bd52c))
    [+0x000] id_              : 0x54
    [+0x004] type_            : CODE_BLOCK (0)
[...]
    [+0x018] name_            : 0xbb96c8 : "_RTC_CheckEsp"
    [+0x01c] compiland_name_  : 0x4c5260 : "f:\binaries\Intermediate\vctools\msvcrt.nativeproj_607447030\objd\x86\_stack_.obj"
[...]
Perfect - that's what we sort of guessed! The last one is just the compiler adding Run-Time Error Checks on us.
Let's have a closer look to the first reference. The references_ member is a hash table of offsets and instances of reference.
// Map of references that this block makes to other blocks.
typedef std::map<Offset, Reference> ReferenceMap;
The offset tells you where exactly in the foo block there is a reference; in our case we can see that the first reference is at offset 57 from the base of the block. If you start IDA real quick and browse at this address, you will see that it points one byte after the PUSH opcode (pointing exactly on the reference to the _Format string):
.text:004010C8 68 20 41 40 00 push offset _Format ; "Binary rewriting with syzygy\n"
Another interesting bit I didn't mention earlier is that naturally the data_ field backs the actual content of the Block:
0:000> u @@c++(block->data_)
0049ef50 55              push    ebp
0049ef51 8bec            mov     ebp,esp
0049ef53 81eccc000000    sub     esp,0CCh
0049ef59 53              push    ebx
0049ef5a 56              push    esi
0049ef5b 57              push    edi
0049ef5c 8dbd34ffffff    lea     edi,[ebp-0CCh]
0049ef62 b933000000      mov     ecx,33h
0:000> dx -r1 (*((instrument!core::AddressRangeMap<core::AddressRange<int,unsigned int>,core::AddressRange<core::detail::AddressImpl<0>,unsigned int> > *)0x4bd36c))
    [+0x000] range_pairs_     : { size=1 }
0:000> dx -r1 (*((instrument!std::vector<std::pair<core::AddressRange<int,unsigned int>,core::AddressRange<core::detail::AddressImpl<0>,unsigned int> >,std::allocator<std::pair<core::AddressRange<int,unsigned int>,core::AddressRange<core::detail::AddressImpl<0>,unsigned int> > > > *)0x4bd36c))
    [0]              : {...}, {...}
0:000> dx -r1 (*((instrument!std::pair<core::AddressRange<int,unsigned int>,core::AddressRange<core::detail::AddressImpl<0>,unsigned int> > *)0x4da1c8))
    first            [Type: core::AddressRange<int,unsigned int>]
    second           [Type: core::AddressRange<core::detail::AddressImpl<0>,unsigned int>]
0:000> dx -r1 (*((instrument!core::AddressRange<int,unsigned int> *)0x4da1c8))
    [+0x000] start_           : 0
    [+0x004] size_            : 0x5b
0:000> dx -r1 (*((instrument!core::AddressRange<core::detail::AddressImpl<0>,unsigned int> *)0x4da1d0))
    [+0x000] start_           [Type: core::detail::AddressImpl<0>]
    [+0x004] size_            : 0x5b
0:000> dx -r1 (*((instrument!core::detail::AddressImpl<0> *)0x4da1d0))
    [+0x000] value_           : 0x1090 [Type: unsigned int]
In this SourceRanges, we have a mapping from the DataRange (RVA 0, size 0x5B), to the SourceRange (RVA 0x1090, size 0x5B - which matches the previous IDA screen shot, obviously). We will come back to those once we have actually modified / rewritten the blocks to see what happens to the SourceRanges.
enum AddressType : uint8_t {
  kRelativeAddressType,
  kAbsoluteAddressType,
  kFileOffsetAddressType,
};

// This class implements an address in a PE image file.
// Addresses are of three varieties:
// - Relative addresses are relative to the base of the image, and thus do not
//   change when the image is relocated. Bulk of the addresses in the PE image
//   format itself are of this variety, and that's where relative addresses
//   crop up most frequently.
// This class is a lightweight wrapper for an integer, which can be freely
// copied. The different address types are deliberately assignment
// incompatible, which helps to avoid confusion when handling different
// types of addresses in implementation.
template <AddressType kType>
class AddressImpl {};

// A virtual address relative to the image base, often termed RVA in
// documentation and in data structure comments.
using RelativeAddress = detail::AddressImpl<kRelativeAddressType>;
Now that you have been introduced to the main concepts, it is time for me to walk you through two small applications.
CallGraphAnalysis
The plan
As the framework exposes all the information you need to rewrite and analyze binary, you are also free to just analyze a binary and not modify a single bit. In this example let's make a Block transform and generate a graph of the relationship between code Blocks (functions). As we are interested in exploring the whole binary and every single code Block, we subclass IterativeTransformImpl:
// Declares a BlockGraphTransform implementation wrapping the common transform
// that iterates over each block in the image.


// An implementation of a BlockGraph transform encapsulating the simple pattern
// of Pre, per-block, and Post functions. The derived class is responsible for
// implementing 'OnBlock' and 'name', and may optionally override Pre and
// Post. The derived type needs to also define the static public member
// variable:
//
//   static const char DerivedType::kTransformName[];
//
// @tparam DerivedType the type of the derived class.
template<class DerivedType>
class IterativeTransformImpl
    : public NamedBlockGraphTransformImpl<DerivedType> { };
Doing so allows us define Pre / Post functions, and an OnBlock function that gets called for every Block encountered in the image. This is pretty handy as I can define an OnBlock callback to mine the information we want for every Block, and define Post to process the data I have accumulated if necessary.
The OnBlock function should be pretty light as we only want to achieve a couple of things:
- Make sure we are dealing with a code Block (and not data),
- Walk every referrers and store pairs of [
ReferrerBlock,CurrentBlock] in a container.
Implementation
The first thing to do is to create a C++ class named CallGraphAnalysis, declared in doare_transform.h and defined in doare_transform.cc. Those files are put in the syzygy/instrument/transforms directory where all others transforms live in:
D:\syzygy\src>git status
On branch dev-doare1
Changes to be committed:
  (use "git reset HEAD <file>..." to unstage)

        new file:   syzygy/instrument/transforms/doare_transforms.cc
        new file:   syzygy/instrument/transforms/doare_transforms.h
In order to get it compiled we also need to modify the instrument.gyp project file:
D:\syzygy\src>git diff syzygy/instrument/instrument.gyp
diff --git a/syzygy/instrument/instrument.gyp b/syzygy/instrument/instrument.gyp
index 464c5566..c0eceb87 100644
--- a/syzygy/instrument/instrument.gyp
+++ b/syzygy/instrument/instrument.gyp
@@ -68,6 +70,8 @@
          'transforms/branch_hook_transform.h',
          'transforms/coverage_transform.cc',
          'transforms/coverage_transform.h',
+        'transforms/doare_transforms.cc',
+        'transforms/doare_transforms.h',
          'transforms/entry_call_transform.cc',
          'transforms/entry_call_transform.h',
          'transforms/entry_thunk_transform.cc',
The gyp file is basically used to generate Ninja project files - which means that if you don't regenerate the Ninja files from the updated version of this gyp file, you will not be compiling your new code. In order to force a regeneration, you can invoke the depot_tools command: gclient runhooks.
At this point we are ready to get our class coded up; here is the class declaration I have:
// Axel '0vercl0k' Souchet - 26 Aug 2017

#ifndef SYZYGY_INSTRUMENT_TRANSFORMS_DOARE_TRANSFORMS_H_
#define SYZYGY_INSTRUMENT_TRANSFORMS_DOARE_TRANSFORMS_H_

#include "base/logging.h"
#include "syzygy/block_graph/transform_policy.h"
#include "syzygy/block_graph/transforms/iterative_transform.h"
#include "syzygy/block_graph/transforms/named_transform.h"

namespace instrument {
namespace transforms {

typedef block_graph::BlockGraph BlockGraph;
typedef block_graph::BlockGraph::Block Block;
typedef block_graph::TransformPolicyInterface TransformPolicyInterface;

class CallGraphAnalysis
    : public block_graph::transforms::IterativeTransformImpl<
          CallGraphAnalysis> {
  public:
  CallGraphAnalysis()
      : edges_(),
        main_block_(nullptr),
        total_blocks_(0),
        total_code_blocks_(0) {}

  static const char kTransformName[];

  // Functions needed for IterativeTransform.
  bool OnBlock(const TransformPolicyInterface* policy,
                BlockGraph* block_graph,
                Block* block);

  private:
  std::list<std::pair<Block*, Block*>> edges_;
  Block* main_block_;

  // Stats.
  size_t total_blocks_;
  size_t total_code_blocks_;
};

}  // namespace transforms
}  // namespace instrument

#endif  // SYZYGY_INSTRUMENT_TRANSFORMS_DOARE_TRANSFORMS_H_
After declaring it, the interesting part for us is to have a look at the OnBlock method:
bool CallGraphAnalysis::OnBlock(const TransformPolicyInterface* policy,
                                BlockGraph* block_graph,
                                Block* block) {
  total_blocks_++;

  if (block->type() != BlockGraph::CODE_BLOCK)
    return true;

  if (block->attributes() & BlockGraph::GAP_BLOCK)
    return true;

  VLOG(1) << __FUNCTION__ << ": " << block->name();
  if (block->name() == "main") {
    main_block_ = block;
  }

  // Walk the referrers of this block.
  for (const auto& referrer : block->referrers()) {
    Block* referrer_block(referrer.first);

    // We are not interested in non-code referrers.
    if (referrer_block->type() != BlockGraph::CODE_BLOCK) {
      continue;
    }

    VLOG(1) << referrer_block->name() << " -> " << block->name();

    // Keep track of the relation between the block & its referrer.
    edges_.emplace_back(referrer_block, block);
  }

  total_code_blocks_++;
  return true;
}
The first step of the method is to make sure that the Block we are dealing with is a block we want to analyze. As I have explained before, Blocks are not exclusive code Blocks. That is the reason why we check the type of the block to only accepts code Blocks. Another type of Block that syzygy artificially creates (it has no existence in the image being analyzed) is called a GAP_BLOCK; which is basically a block that fills a gap in the address space. For that reason we also skip those blocks.
At this point we have a code Block and we can start to mine whatever information needed: name, size, referrers, etc. As the thing we are mostly interested about is the relationships between the code Blocks, we have to walk the referrers. The only thing to be wary about is to also exclude data Blocks (a function pointer table would be a data Block referencing a code Block for example) there. After this minor filtering we can just add the two pointers into the container.
I am sure at this stage you are interested in compiling it, and get it to run on a binary. To do that we need to add the plumbing necessary to surface it to instrument.exe tool. First thing you need is an instrumenter, we declare it in doare_instrumenter.h and define it in doare_instrumenter.cc in the syzygy/instrument/instrumenters directory:
D:\syzygy\src>git status
On branch dev-doare1
Changes to be committed:
  (use "git reset HEAD <file>..." to unstage)

        new file:   syzygy/instrument/instrumenters/doare_instrumenter.cc
        new file:   syzygy/instrument/instrumenters/doare_instrumenter.h
An instrumenter is basically a class that encapsulate the configuration and the invocation of one or several transforms. The instrumenter can receive options passed by the application, thus can set configuration flags when invoking the transforms, etc. You could imagine parsing a configuration file here, or doing any preparation needed by your transform. Then, the instrumenter registers the transform against the Relinker object (a bit like the pass manager in LLVM if you want to think about it this way).
Anyway, as our transform is trivial we basically don't need any of this "preparation"; so let's settle for the least required:
// Axel '0vercl0k' Souchet - 26 Aug 2017

#ifndef SYZYGY_INSTRUMENT_INSTRUMENTERS_DOARE_INSTRUMENTER_H_
#define SYZYGY_INSTRUMENT_INSTRUMENTERS_DOARE_INSTRUMENTER_H_

#include "base/command_line.h"
#include "syzygy/instrument/instrumenters/instrumenter_with_agent.h"
#include "syzygy/instrument/transforms/doare_transforms.h"
#include "syzygy/pe/pe_relinker.h"

namespace instrument {
namespace instrumenters {

class DoareInstrumenter : public InstrumenterWithRelinker {
  public:
  typedef InstrumenterWithRelinker Super;

  DoareInstrumenter() : Super() {}

  // From InstrumenterWithRelinker
  bool InstrumentPrepare() override;
  bool InstrumentImpl() override;
  const char* InstrumentationMode() override;

  private:
  // The transform for this agent.
  std::unique_ptr<instrument::transforms::CallGraphAnalysis>
      transformer_callgraph_;

  DISALLOW_COPY_AND_ASSIGN(DoareInstrumenter);
};

}  // namespace instrumenters
}  // namespace instrument

#endif  // SYZYGY_INSTRUMENT_INSTRUMENTERS_DOARE_INSTRUMENTER_H_
The InstrumentPrepare method is where the instrumenter registers the transform against the relinker object:
// Axel '0vercl0k' Souchet - 26 Aug 2017

#include "syzygy/instrument/instrumenters/doare_instrumenter.h"

#include "base/logging.h"
#include "base/values.h"
#include "syzygy/application/application.h"

namespace instrument {
namespace instrumenters {

bool DoareInstrumenter::InstrumentPrepare() {
  return true;
}

bool DoareInstrumenter::InstrumentImpl() {
  transformer_callgraph_.reset(new instrument::transforms::CallGraphAnalysis());

  if (!relinker_->AppendTransform(transformer_callgraph_.get())) {
    LOG(ERROR) << "AppendTransform failed.";
    return false;
  }

  return true;
}

const char* DoareInstrumenter::InstrumentationMode() {
  return "Diary of a reverse engineer";
}
}  // namespace instrumenters
}  // namespace instrument
Like before, we also need to add those two files in the instrument.gyp file and regenerate the Ninja project files via the gclient runhooks command:
D:\syzygy\src>git diff syzygy/instrument/instrument.gyp
diff --git a/syzygy/instrument/instrument.gyp b/syzygy/instrument/instrument.gyp
index 464c5566..c0eceb87 100644
--- a/syzygy/instrument/instrument.gyp
+++ b/syzygy/instrument/instrument.gyp
@@ -36,6 +36,8 @@
          'instrumenters/bbentry_instrumenter.h',
          'instrumenters/coverage_instrumenter.cc',
          'instrumenters/coverage_instrumenter.h',
+        'instrumenters/doare_instrumenter.h',
+        'instrumenters/doare_instrumenter.cc',
          'instrumenters/entry_call_instrumenter.cc',
          'instrumenters/entry_call_instrumenter.h',
          'instrumenters/entry_thunk_instrumenter.cc',
@@ -68,6 +70,8 @@
          'transforms/branch_hook_transform.h',
          'transforms/coverage_transform.cc',
          'transforms/coverage_transform.h',
+        'transforms/doare_transforms.cc',
+        'transforms/doare_transforms.h',
          'transforms/entry_call_transform.cc',
          'transforms/entry_call_transform.h',
          'transforms/entry_thunk_transform.cc',
The last step for us is to surface our instrumenter to the main of the application. I just add a mode called doare that you can set via the --mode switch, and if the flag is specified it instantiates the newly born DoareInstrumenter.
D:\syzygy\src>git diff syzygy/instrument/instrument_app.cc
diff --git a/syzygy/instrument/instrument_app.cc b/syzygy/instrument/instrument_app.cc
index 72bb40b8..c54258d8 100644
--- a/syzygy/instrument/instrument_app.cc
+++ b/syzygy/instrument/instrument_app.cc
@@ -29,6 +29,7 @@
  #include "syzygy/instrument/instrumenters/bbentry_instrumenter.h"
  #include "syzygy/instrument/instrumenters/branch_instrumenter.h"
  #include "syzygy/instrument/instrumenters/coverage_instrumenter.h"
+#include "syzygy/instrument/instrumenters/doare_instrumenter.h"
  #include "syzygy/instrument/instrumenters/entry_call_instrumenter.h"
  #include "syzygy/instrument/instrumenters/entry_thunk_instrumenter.h"
  #include "syzygy/instrument/instrumenters/flummox_instrumenter.h"
@@ -41,7 +42,7 @@ static const char kUsageFormatStr[] =
      "Usage: %ls [options]\n"
      "  Required arguments:\n"
      "    --input-image=<path> The input image to instrument.\n"
-    "    --mode=afl|asan|bbentry|branch|calltrace|coverage|flummox|profile\n"
+    "    --mode=afl|asan|bbentry|branch|calltrace|coverage|doare|flummox|profile\n"
      "                            Specifies which instrumentation mode is to\n"
      "                            be used. If this is not specified it is\n"
      "                            equivalent to specifying --mode=calltrace\n"
@@ -192,6 +193,8 @@ bool InstrumentApp::ParseCommandLine(const base::CommandLine* cmd_line) {
            instrumenters::EntryThunkInstrumenter::CALL_TRACE));
      } else if (base::LowerCaseEqualsASCII(mode, "coverage")) {
        instrumenter_.reset(new instrumenters::CoverageInstrumenter());
+    } else if (base::LowerCaseEqualsASCII(mode, "doare")) {
+      instrumenter_.reset(new instrumenters::DoareInstrumenter());
      } else if (base::LowerCaseEqualsASCII(mode, "flummox")) {
        instrumenter_.reset(new instrumenters::FlummoxInstrumenter());
      } else if (base::LowerCaseEqualsASCII(mode, "profile")) {
This should be it! Recompiling the instrument project should be enough to be able to invoke the transform and see some of our debug messages:
D:\Downloads\syzygy\src>ninja -C out\Release instrument
ninja: Entering directory `out\Release'
[4/4] LINK_EMBED instrument.exe

D:\Downloads\syzygy\src>out\Release\instrument.exe --input-image=out\Release\instrument.exe --output-image=nul --mode=doare --verbose
[...]
[0902/120452:VERBOSE1:doare_transforms.cc(22)] instrument::transforms::CallGraphAnalysis::OnBlock: block_graph::BlockGraph::AddressSpace::GetBlockByAddress
[0902/120452:VERBOSE1:doare_transforms.cc(36)] pe::`anonymous namespace'::Decompose -> block_graph::BlockGraph::AddressSpace::GetBlockByAddress
[0902/120452:VERBOSE1:doare_transforms.cc(36)] pe::`anonymous namespace'::Decompose -> block_graph::BlockGraph::AddressSpace::GetBlockByAddress
[...]
Visualize it?
As I was writing this I figured it might be worth to spend a bit of time trying to visualize this network to make it more attractive for the readers. So I decided to use visjs and the Post callback to output the call-graph in a way visjs would understand:
bool CallGraphAnalysis::PostBlockGraphIteration(
    const TransformPolicyInterface* policy,
    BlockGraph* block_graph,
    Block* header_block) {
  VLOG(1) << "      Blocks found: " << total_blocks_;
  VLOG(1) << " Code Blocks found: " << total_code_blocks_;

  if (main_block_ == nullptr) {
    LOG(ERROR) << "A 'main' block is mandatory.";
    return false;
  }

  // Now we walk the graph from the 'main' block, with a BFS algorithm.
  uint32_t idx = 0, level = 0;
  std::list<std::pair<Block*, Block*>> selected_edges;
  std::map<Block*, uint32_t> selected_nodes;
  std::map<Block*, uint32_t> selected_nodes_levels;
  std::set<Block*> nodes_to_inspect{main_block_};
  while (nodes_to_inspect.size() > 0) {
    // Make a copy of the node to inspect so that we can iterate
    // over them.
    std::set<Block*> tmp = nodes_to_inspect;

    // The node selected to be inspected in the next iteration of
    // the loop will be added in this set.
    nodes_to_inspect.clear();

    // Go through every nodes to find to what nodes they are connected
    // to.
    for (const auto& node_to_inspect : tmp) {
      // Assign an index and a level to the node.
      selected_nodes.emplace(node_to_inspect, idx++);
      selected_nodes_levels[node_to_inspect] = level;

      // Now let's iterate through the edges to find to what nodes, the current
      // one is connected to.
      for (const auto& edge : edges_) {
        // We are interested to find edges connected to the current node.
        if (edge.first != node_to_inspect) {
          continue;
        }

        // Get the connected node and make sure we haven't handled it already.
        Block* to_block(edge.second);
        if (selected_nodes.count(to_block) > 0) {
          continue;
        }

        selected_nodes.emplace(to_block, idx++);
        selected_nodes_levels[to_block] = level + 1;

        // If it's a
        selected_edges.emplace_back(node_to_inspect, to_block);

        // We need to analyze this block at the next iteration (level + 1).
        nodes_to_inspect.insert(to_block);
      }
    }

    // Bump the level as we finished analyzing the nodes we wanted to inspect.
    level++;
  }

  std::cout << "var nodes = new vis.DataSet([" << std::endl;
  for (const auto& node : selected_nodes) {
    Block* block(node.first);
    const char* compiland_path = block->compiland_name().c_str();
    const char* compiland_name = strrchr(compiland_path, '\\');
    char description[1024];

    if (compiland_name != nullptr) {
      compiland_name++;
    } else {
      compiland_name = "Unknown";
    }

    uint32_t level = selected_nodes_levels[block];
    _snprintf_s(description, ARRAYSIZE(description), _TRUNCATE,
                "RVA: %p<br>Size: %d<br>Level: %d<br>Compiland: %s",
                (void*)block->addr().value(), block->size(), level,
                compiland_name);

    std::cout << "  { id : " << node.second << ", label : \"" << block->name()
              << "\", "
              << "title : '" << description << "', group : " << level
              << ", value : " << block->size() << " }," << std::endl;
  }
  std::cout << "]);" << std::endl
            << std::endl;

  std::cout << "var edges = new vis.DataSet([" << std::endl;
  for (const auto& edge : selected_edges) {
    std::cout << "  { from : " << selected_nodes.at(edge.first)
              << ", to : " << selected_nodes.at(edge.second) << " },"
              << std::endl;
  }
  std::cout << "]);" << std::endl;
  return true;
}
The above function basically starts to walk the network from the main function and do a BFS algorithm (that allows us to define levels for each Block). It then outputs two sets of data: the nodes, and the edges.
If you would like to check out the result I have uploaded an interactive network graph here: network.afl-fuzz.exe.html. Even though it sounds pretty useless, it looks pretty cool!
SecurityCookieCheckHookTransform
The problem
The idea for this transform came back when I was playing around with WinAFL; I encountered a case where one of the test-case triggered a /GS violation in a harness program I was fuzzing. Buffer security checks are a set of compiler and runtime instrumentation aiming at detecting and preventing the exploitation of stack-based buffer overflows. A cookie is placed on the stack by the prologue of the protected function in between the local variables of the stack-frame and the saved stack pointer / saved instruction pointer. The compiler instruments the code so that before the function returns, it invokes a check function (called __security_check_cookie) that ensure the integrity of the cookie.
; void __fastcall __security_check_cookie(unsigned int cookie)
@__security_check_cookie@4 proc near
cookie= dword ptr -4
    cmp     ecx, ___security_cookie
    repne jnz short failure
    repne retn
failure:
    repne jmp ___report_gsfailure
@__security_check_cookie@4 endp
If the cookie matches the secret, everything is fine, the function returns and life goes on. If it does not, it means something overwrote it and as a result the process needs to be killed. The way the check function achieves this is by raising an exception that the process cannot even catch itself; which makes sense if you think about it as you don't want an attacker to be able to hijack the exception.
On recent version of Windows, this is achieved via a fail-fast exception or by invoking [UnhandledExceptionFilter](https://msdn.microsoft.com/en-us/library/windows/desktop/ms681401(v=vs.85).aspx) (after forcing the top level exception filter to 0) and terminating the process (done by __raise_securityfailure).
; void __cdecl __raise_securityfailure(_EXCEPTION_POINTERS *const exception_pointers)
___raise_securityfailure proc near
exception_pointers= dword ptr  8
    push    ebp
    mov     ebp, esp
    push    0
    call    ds:__imp__SetUnhandledExceptionFilter@4
    mov     eax, [ebp+exception_pointers]
    push    eax
    call    ds:__imp__UnhandledExceptionFilter@4
    push    0C0000409h
    call    ds:__imp__GetCurrentProcess@0
    push    eax
    call    ds:__imp__TerminateProcess@8
    pop     ebp
    retn
___raise_securityfailure endp
Funny enough - if this sounds familiar - turns out I have encountered this very problem a while back and you can read the story here: Having a Look at the Windows' User/Kernel Exceptions Dispatcher.
The thing is when you are fuzzing, this is exactly the type of thing you would like to be aware of. WinAFL uses an in-process exception handler to do the crash monitoring part which means that this type of crashes would not go through the crash monitoring. Bummer.
The solution
I started evaluating syzygy with this simple task: making the program crash with a regular exception (that can get caught by an in-process exception handler). I figured it would be a walk in the park, as I basically needed to apply very little transformation to the binary to make this work.
First step is to define a transform as in the previous example. This time I subclass NamedBlockGraphTransformImpl which wants me to implement a TransformBlockGraph method that receives: a transform policy (used to make decision before applying transformation), the graph (block_graph) and a data Block that represents the PE header of our image (header_block):
class SecurityCookieCheckHookTransform
    : public block_graph::transforms::NamedBlockGraphTransformImpl<
          SecurityCookieCheckHookTransform> {
  public:
  SecurityCookieCheckHookTransform() {}

  static const char kTransformName[];
  static const char kReportGsFailure[];
  static const char kSyzygyReportGsFailure[];
  static const uint32_t kInvalidUserAddress;

  // BlockGraphTransformInterface implementation.
  bool TransformBlockGraph(const TransformPolicyInterface* policy,
                            BlockGraph* block_graph,
                            BlockGraph::Block* header_block) final;
};
As I explained a bit earlier, the BlockGraph is the top level container of Blocks. This is what I walk through in order to find our Block of interest. The Block of interest for us has the name __report_gsfailure:
BlockGraph::Block* report_gsfailure = nullptr;
BlockGraph::BlockMap& blocks = block_graph->blocks_mutable();
for (auto& block : blocks) {
  std::string name(block.second.name());
  if (name == kReportGsFailure) {
    report_gsfailure = &block.second;
    break;
  }
}

if (report_gsfailure == nullptr) {
  LOG(ERROR) << "Could not find " << kReportGsFailure << ".";
  return false;
}
The transform tries to be careful by checking that the Block only has a single referrer: which should be the __security_cookie_check Block. If not, I gracefully exit and don't apply the transformation as I am not sure with what I am dealing with.
if (report_gsfailure->referrers().size() != 1) {
  // We bail out if we don't have a single referrer as the only
  // expected referrer is supposed to be __security_cookie_check.
  // If there is more than one, we would rather bail out than take
  // a chance at modifying the behavior of the PE image.
  LOG(ERROR) << "Only a single referrer to " << kReportGsFailure
              << " is expected.";
  return false;
}
At this point, I create a new Block that has only a single instruction designed to trigger a fault every time; to do so I can even use the basic Intel assembler integrated in syzygy. After this, I place this new Block inside the .text section the image (tracked by the BlockGraph as mentioned earlier).
BlockGraph::Section* section_text = block_graph->FindOrAddSection(
    pe::kCodeSectionName, pe::kCodeCharacteristics);

// All of the below is needed to build the instrumentation via the assembler.
BasicBlockSubGraph bbsg;
BasicBlockSubGraph::BlockDescription* block_desc = bbsg.AddBlockDescription(
    kSyzygyReportGsFailure, nullptr, BlockGraph::CODE_BLOCK,
    section_text->id(), 1, 0);

BasicCodeBlock* bb = bbsg.AddBasicCodeBlock(kSyzygyReportGsFailure);
block_desc->basic_block_order.pushf_back(bb);
BasicBlockAssembler assm(bb->instructions().begin(), &bb->instructions());
assm.mov(Operand(Displacement(kInvalidUserAddress)), assm::eax);

// Condense into a block.
BlockBuilder block_builder(block_graph);
if (!block_builder.Merge(&bbsg)) {
  LOG(ERROR) << "Failed to build " << kSyzygyReportGsFailure << " block.";
  return false;
}

DCHECK_EQ(1u, block_builder.new_blocks().size());
Finally, I update all the referrers to point to our new Block, and remove the __report_gsfailure Block as it is effectively now dead-code:
// Transfer the referrers to the new block, and delete the old one.
BlockGraph::Block* syzygy_report_gsfailure =
    block_builder.new_blocks().front();
report_gsfailure->TransferReferrers(
    0, syzygy_report_gsfailure,
    BlockGraph::Block::kTransferInternalReferences);

report_gsfailure->RemoveAllReferences();
if (!block_graph->RemoveBlock(report_gsfailure)) {
  LOG(ERROR) << "Removing " << kReportGsFailure << " failed.";
  return false;
}
Here is what it looks like after our transformation:
; void __fastcall __security_check_cookie(unsigned int cookie)
@__security_check_cookie@4 proc near
cookie = ecx
                cmp     cookie, ___security_cookie
                repne jnz short failure
                repne retn
failure:
                repne jmp loc_426EE6 <- our new __report_gsfailure block

loc_426EE6:
                mov     ds:0DEADBEEFh, eax
One does not simply binary rewrite
It may look like an easy problem without any pitfall, but before settling down on the solution above I actually first tried to rewrite the __security_check_cookie function. I thought it would be cleaner and it was also very easy to do with syzygy. I had to create a new Block, and transfer the referrers to my new block and.. that was it!
Now it was working fine on a bunch of targets on various OSs: Windows 7, Windows 8, Windows 8.1, Windows 10. Until I started notice some instrumented binaries that would not even execute; the loader would not load the binary and I was left with some message box telling me the binary could not be loaded in memory: STATUS_INVALID_IMAGE_FORMAT or 0xc000007b. This was pretty mysterious at first as the instrumented binary would run fine on Windows 7 but not on Windows 10. The instrumented binary also looked instrumented fine - the way I wanted it to be instrumented: all the callers of __security_check_cookie were now calling into my new function and nothing seemed off.
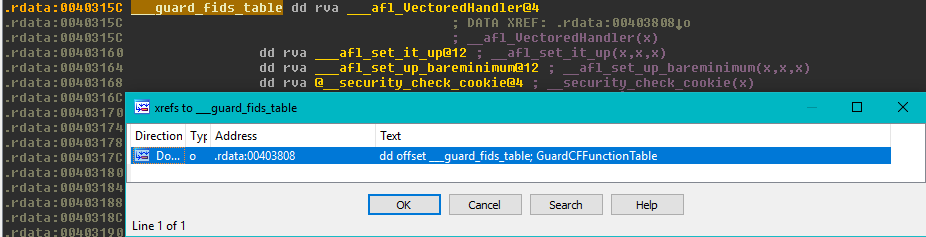
At this point, the only thing I knew was that the PE loader was not happy with the file; so that is where I started my investigation. After hours of back and forth between ntdll and the kernel I found that the CFG [LoadConfigDirectory.GuardCFFunctionTable](https://msdn.microsoft.com/en-us/library/windows/desktop/ms680547(v=vs.85).aspx) table (where the compiler puts all the valid indirect-call targets) embedded in binaries is expected to be ordered from low to high RVAs. I have also realized at this point that one of the referrer of my block was this CFG table, that would get fixed-up with the RVA of wherever the new block was placed by the binary rewriting framework. And of course, in some cases this RVA would end up being greater than the RVA right after in the table... upsetting the loader.
Last words
In this post I have introduced the syzygy framework, presented some of its strengths as well as limitations, and illustrated what can you do with it on two simple examples. I am hoping to be able to write a second post where I can talk a bit more of two other transforms I have designed to built the static instrumentation mode of WinAFL and how every pieces work together. I would also like to try to see if I can't cook some obfuscation or something of the sort.
As usual you can find the codes on my github here: stuffz/syzygy.
If you can't wait for the next post, you can have already a look at add_implicit_tls_transform.cc and afl_transform.cc.
Last but not least, special shout-outs to my proofreader yrp.