Introduction
Sometimes, when you are reverse-engineering binaries you need somehow to measure, or just to have an idea about how much "that" execution is covering the code of your target. It can be for fuzzing purpose, maybe you have a huge set of inputs (it can be files, network traffic, anything) and you want to have the same coverage with only a subset of them. Or maybe, you are not really interested in the measure, but only with the coverage differences between two executions of your target: to locate where your program is handling a specific feature for example.
But it's not a trivial problem, usually you don't have the source-code of the target, and you want it to be quick. The other thing, is that you don't have an input that covers the whole code base, you don't even know if it's possible ; so you can't compare your analysis to that "ideal one". Long story short, you can't say to the user "OK, this input covers 10% of your binary". But you can clearly register what your program is doing with input A, what it is doing with input B and then analyzing the differences. With that way you can have a (more precise?) idea about which input seems to have better coverage than another.
Note also, this is a perfect occasion to play with Pin :-)).
In this post, I will explain briefly how you can build that kind of tool using Pin, and how it can be used for reverse-engineer purposes.
Our Pintool
If you have never heard about Intel's DBI framework Pin, I have made a selection of links for you, read them and understand them ; you won't be able of using correctly Pin, if you don't know a bit how it works:
Concerning my setup, I'm using Pin 2.12 on Windows 7 x64 with VC2010 and I'm building x86 Pintools (works great with Wow64). If you want to build easily your Pintool outside of the Pin tool kit directory I've made a handy little python script: setup_pintool_project.py.
Before coding, we need to talk a bit about what we really want. This is simple, we want a Pintool that:
- is the more efficient possible. OK, that's a real problem ; even if Pin is more efficient than other DBI framework (like DynamoRio or Valgrind), it is always kind of slow.
- keeps track of all the basic blocks executed. We will store the address of each basic block executed and its number of instructions.
- generates a JSON report about a specific execution. Once we have that report, we are free to use Python scripts to do whatever we want. To do that, we will use Jansson: it's easy to use, open-source and written in C.
- doesn't instrument Windows APIs. We don't want to waste our CPU time being in the native libraries of the system ; it's part of our little "tricks" to improve the speed of our Pintool.
I think it's time to code now: first, let's define several data structures in order to store the information we need:
typedef std::map<std::string, std::pair<ADDRINT, ADDRINT> > MODULE_BLACKLIST_T;
typedef MODULE_BLACKLIST_T MODULE_LIST_T;
typedef std::map<ADDRINT, UINT32> BASIC_BLOCKS_INFO_T;
The two first types will be used to hold modules related information: path of the module, start address and end address. The third one is simple: the key is the basic block address and the value is its number of instructions.
Then we are going to define our instrumentation callback:
- one to know whenever a module is loaded in order to store its base/end address, one for the traces. You can set the callbacks using IMG_AddInstrumentationFunction and TRACE_AddInstrumentationFunction.
VOID image_instrumentation(IMG img, VOID * v)
{
    ADDRINT module_low_limit = IMG_LowAddress(img), module_high_limit = IMG_HighAddress(img);

    if(IMG_IsMainExecutable(img))
        return;

    const std::string image_path = IMG_Name(img);

    std::pair<std::string, std::pair<ADDRINT, ADDRINT> > module_info = std::make_pair(
        image_path,
        std::make_pair(
            module_low_limit,
            module_high_limit
        )
    );

    module_list.insert(module_info);
    module_counter++;

    if(is_module_should_be_blacklisted(image_path))
        modules_blacklisted.insert(module_info);
}
- one to be able to insert calls before every basic blocks.
The thing is: Pin doesn't have a BBL_AddInstrumentationFunction, so we have to instrument the traces, iterate through them to get the basic block. It's done really easily with TRACE_BblHead, BBL_Valid and BBL_Next functions. Of course, if the basic block address is in a blacklisted range address, we don't insert a call to our analysis function.
VOID trace_instrumentation(TRACE trace, VOID *v)
{
    for(BBL bbl = TRACE_BblHead(trace); BBL_Valid(bbl); bbl = BBL_Next(bbl))
    {
        if(is_address_in_blacklisted_modules(BBL_Address(bbl)))
            continue;

        BBL_InsertCall(
            bbl,
            IPOINT_ANYWHERE,
            (AFUNPTR)handle_basic_block,
            IARG_FAST_ANALYSIS_CALL,

            IARG_UINT32,
            BBL_NumIns(bbl),

            IARG_ADDRINT,
            BBL_Address(bbl),

            IARG_END
        );
    }
}
For efficiency reasons, we let decide Pin about where it puts its JITed call to the analysis function handle_basic_block ; we also use the fast linkage (it basically means the function will be called using the __fastcall calling convention).
The analysis function is also very trivial, we just need to store basic block addresses in a global variable. The method doesn't have any branch, it means Pin will most likely inlining the function, that's also cool for the efficiency.
VOID PIN_FAST_ANALYSIS_CALL handle_basic_block(UINT32 number_instruction_in_bb, ADDRINT address_bb)
{
    basic_blocks_info[address_bb] = number_instruction_in_bb;
}
Finally, just before the process ends we serialize our data in a simple JSON report thanks to jansson. You may also want to use a binary serialization to have smaller report.
VOID save_instrumentation_infos()
{
    /// basic_blocks_info section
    json_t *bbls_info = json_object();
    json_t *bbls_list = json_array();
    json_t *bbl_info = json_object();
    // unique_count field
    json_object_set_new(bbls_info, "unique_count", json_integer(basic_blocks_info.size()));
    // list field
    json_object_set_new(bbls_info, "list", bbls_list);
    for(BASIC_BLOCKS_INFO_T::const_iterator it = basic_blocks_info.begin(); it != basic_blocks_info.end(); ++it)
    {
        bbl_info = json_object();
        json_object_set_new(bbl_info, "address", json_integer(it->first));
        json_object_set_new(bbl_info, "nbins", json_integer(it->second));
        json_array_append_new(bbls_list, bbl_info);
    }

    /* .. same thing for blacklisted modules, and modules .. */
    /// Building the tree
    json_t *root = json_object();
    json_object_set_new(root, "basic_blocks_info", bbls_info);
    json_object_set_new(root, "blacklisted_modules", blacklisted_modules);
    json_object_set_new(root, "modules", modules);

    /// Writing the report
    FILE* f = fopen(KnobOutputPath.Value().c_str(), "w");
    json_dumpf(root, f, JSON_COMPACT | JSON_ENSURE_ASCII);
    fclose(f);
}
If like me you are on a x64 Windows system, but you are instrumenting x86 processes you should directly blacklist the area where Windows keeps the SystemCallStub (you know the "JMP FAR"). To do that, we simply use the __readfsdword intrinsic in order to read the field TEB32.WOW32Reserved that holds the address of that stub. Like that you won't waste your CPU time every time your program is performing a system call.
ADDRINT wow64stub = __readfsdword(0xC0);
modules_blacklisted.insert(
    std::make_pair(
        std::string("wow64stub"),
        std::make_pair(
            wow64stub,
            wow64stub
        )
    )
);
The entire Pintool source code is here: pin-code-coverage-measure.cpp.
I want to see the results.
I agree that's neat to have a JSON report with the basic blocks executed by our program, but it's not really readable for a human. We can use an IDAPython script that will parse our report, and will color all the instructions executed. It should be considerably better to see the execution path used by your program.
To color an instruction you have to use the functions: idaapi.set_item_color and idaapi.del_item_color (if you want to reset the color). You can also use idc.GetItemSize to know the size of an instruction, like that you can iterate for a specific number of instruction (remember, we stored that in our JSON report!).
# idapy_color_path_from_json.py
import json
import idc
import idaapi

def color(ea, nbins, c):
    '''Color 'nbins' instructions starting from ea'''
    colors = defaultdict(int, {
            'black' : 0x000000,
            'red' : 0x0000FF,
            'blue' : 0xFF0000,
            'green' : 0x00FF00
        }
    )
    for _ in range(nbins):
        idaapi.del_item_color(ea)
        idaapi.set_item_color(ea, colors[c])
        ea += idc.ItemSize(ea)

def main():
    f = open(idc.AskFile(0, '*.json', 'Where is the JSON report you want to load ?'), 'r')
    c = idc.AskStr('black', 'Which color do you want ?').lower()
    report = json.load(f)
    for i in report['basic_blocks_info']['list']:
        print '%x' % i['address'],
        try:
            color(i['address'], i['nbins'], c)
            print 'ok'
        except Exception, e:
            print 'fail: %s' % str(e)
    print 'done'
    return 1

if __name__ == '__main__':
    main()
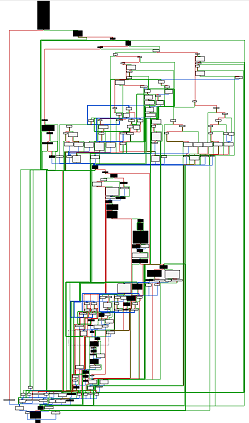
Here is an example generated by launching "ping google.fr", we can clearly see in black the nodes reached by the ping utility:
Trace differences
As you saw previously, it can be handy to actually see the execution path our program took. But if you think about it, it can be even more handy to have a look at the differences between two different executions. It could be used to locate a specific feature of a program: like a license check, where an option is checked, etc.
Now, let's run another trace with for example "ping -n 10 google.fr". Here are the two executions traces and the difference between the two others (the previous one, and the new):
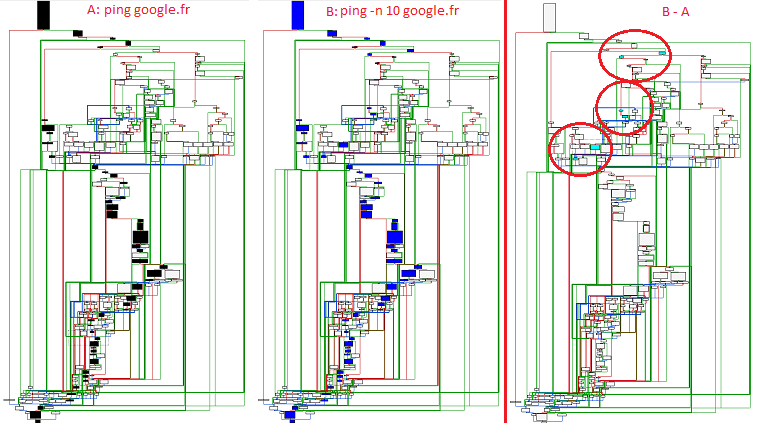
- You launch the application, and you exit
- You launch the application, you do something and you exit
- You remove the basic blocks executed in the first run in the second trace ; in order to keep only the part that does the "do something" thing. That way you filter the noise induced by the GUI to focus only on the interesting part.
Cool for us because that's pretty easy to implement via IDAPython, here is the script:
# idapy_color_diff_from_jsons.py https://github.com/0vercl0k/stuffz/blob/master/pin-code-coverage-measure/idapy_color_diff_from_jsons.py
import json
import idc
import idaapi
from collections import defaultdict

def color(ea, nbins, c):
    '''Color 'nbins' instructions starting from ea'''
    colors = defaultdict(int, {
            'black' : 0x000000,
            'red' : 0x0000FF,
            'blue' : 0xFF0000,
            'green' : 0x00FF00
        }
    )
    for _ in range(nbins):
        idaapi.del_item_color(ea)
        idaapi.set_item_color(ea, colors[c])
        ea += idc.ItemSize(ea)

def main():
    f = open(idc.AskFile(0, '*.json', 'Where is the first JSON report you want to load ?'), 'r')
    report = json.load(f)
    l1 = report['basic_blocks_info']['list']

    f = open(idc.AskFile(0, '*.json', 'Where is the second JSON report you want to load ?'), 'r')
    report = json.load(f)
    l2 = report['basic_blocks_info']['list']
    c = idc.AskStr('black', 'Which color do you want ?').lower()

    addresses_l1 = set(r['address'] for r in l1)
    addresses_l2 = set(r['address'] for r in l2)
    dic_l2 = dict((k['address'], k['nbins']) for k in l2)

    diff = addresses_l2 - addresses_l1
    print '%d bbls in the first execution' % len(addresses_l1)
    print '%d bbls in the second execution' % len(addresses_l2)
    print 'Differences between the two executions: %d bbls' % len(diff)

    assert(len(addresses_l1) < len(addresses_l2))

    funcs = defaultdict(list)
    for i in diff:
        try:
            color(i, dic_l2[i], c)
            funcs[get_func(i).startEA].append(i)
        except Exception, e:
            print 'fail %s' % str(e)

    print 'A total of %d different sub:' % len(funcs)
    for s in funcs.keys():
        print '%x' % s

    print 'done'
    return 1

if __name__ == '__main__':
    main()
By the way, you must keep in mind we are only talking about deterministic program (will always execute the same path if you give it the same inputs). If the same inputs aren't giving the exact same outputs every time, your program is not deterministic.
Also, don't forget about ASLR because if you want to compare basic block addresses executed at two different times, trust me you want your binary loaded at the same base address. However, if you want to patch quickly a simple file I've made a little Python script that can be handy sometimes: remove_aslr_bin.py ; otherwise, booting your Windows XP virtual machine is the easy solution.
Does-it scale ?
These tests have been done on my Windows 7 x64 laptop with Wow64 processes (4GB RAM, i7 Q720 @ 1.6GHz). All the modules living in C:\Windows have been blacklisted. Also, note those tests are not really accurate, I didn't launch each thing thousand times, it's just here to give you a vague idea.
Portable Python 2.7.5.1
Without instrumentation
PS D:\> Measure-Command {start-process python.exe "-c 'quit()'" -Wait}

TotalMilliseconds : 73,1953
With instrumentation and JSON report serialization
PS D:\> Measure-Command {start-process pin.exe "-t pin-code-coverage-measure.dll -o test.json -- python.exe -c 'quit()'" -Wait}

TotalMilliseconds : 13122,4683
VLC 2.0.8
Without instrumentation
PS D:\> Measure-Command {start-process vlc.exe "--play-and-exit hu" -Wait}

TotalMilliseconds : 369,4677
With instrumentation and JSON report serialization
PS D:\> Measure-Command {start-process pin.exe "-t pin-code-coverage-measure.dll -o test.json -- D:\vlc.exe --play-and-exit hu" -Wait}

TotalMilliseconds : 60109,204
To optimize the process you may want to blacklist some of the VLC plugins (there are a tons!), otherwise your VLC instrumented is 160 times slower than the normal one (and I didn't even try to launch the instrumentation when decoding x264 videos).
Browsers ?
You don't want to see the overhead here.
Conclusion
If you want to use that kind of tool for fuzzing purposes, I definitely encourage you to make a little program that uses the library you are targeting the same way your target does. This way you have a really smaller and less complicate binary to instrument, thus the instrumentation process will be far more efficient. And in this specific case, I really believe you can launch this Pintool on a large set of inputs (thousands) in order to pick inputs that cover better your target. In the other hand, if you do that directly on big software like browsers: it won't scale because you will pass your time instrumenting GUI or stuff you don't care.
Pin is a really powerful and accessible tool. The C++ API is really easy to use, it works with Linux, OSX, Android for x86, (even X86_64 on the important targets), there is also a doxygen documentation. What else seriously ?
Use it, it's good for you.
References & sources of inspiration
If you find that subject cool, I've made a list of cool readings:
- Coverage analyzer: You will see using Pin is really easier
- Code-coverage-analysis-tool: That's cool, but it seems to instrument at the routine level ; we wanted to have information at the basic level
- Binary instrumentation for security professionals
- MyNav, a python plugin
- zynamics BinNavi Videos
- Differential Slicing: Identifying Causal Execution Differences for Security Applications (thanks for the reference j04n!)